
With the large amounts of data captured and stored by organisations, how can we utilise them to provide meaningful and actionable insights? This is where data science comes in.
Data Science
Data science is an interdisciplinary field whereby various systems and tools are used to turn data into actionable information. In general, substantial domain knowledge, programming and hacking skills, and math and statistics knowledge, are required. This is best expressed in the Data Science Venn Diagram by Drew Conway below.
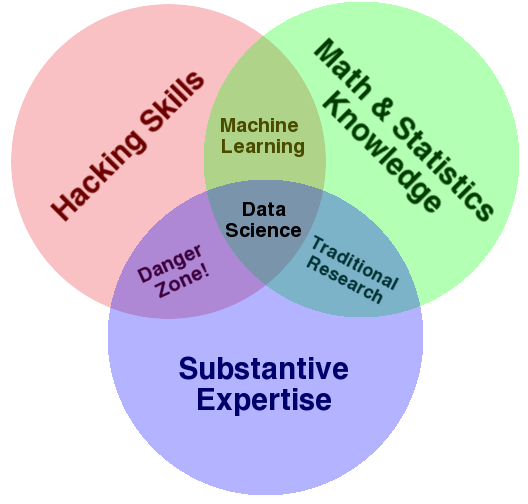
Drew Conway, Data Science Venn Diagram, Creative Commons licensed as Attribution-NonCommercial.
Data Science Process
The Data Science Process is a framework created by Joe Blitzstein and Hanspeter Pfister for approaching data science tasks, and consists of the stages below.
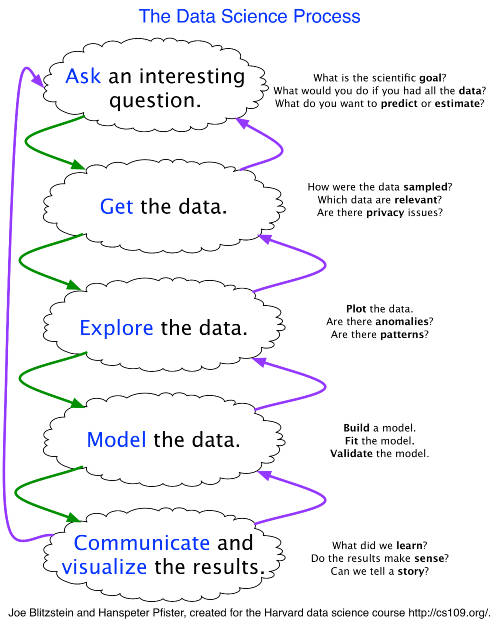
Stage 1: Ask a question – What is the problem we are trying to solve?
Stage 2: Get the data – What are the data sources required? How can we clean or transform the data into a structured format?
Stage 3: Explore the data – Are there any patterns in the data? Are there any anomalies or data issues?
Stage 4: Model the data – Can we build a model with the data and validate it?
Stage 5: Communicate the data – What are the results? How can we best communicate the findings to stakeholders?
Data Analytics
Generally, the end product of the data science process is data analytics. There are 3 main types of analytics – descriptive, predictive, and prescriptive.
Descriptive analytics tells you what has happened in the past, and not why it happened. They are often presented in the form of dashboards, scorecards, reports, or alerts. Common examples include financial reports or a sales pipeline dashboard.
A more advanced form of analytics – diagnostic analytics, tells us why it happened through the use of techniques such as drill-downs and data discovery. Tools such as QlikView and Tableau provide solutions for self service data discovery and analytics.
Predictive analytics tells us what is likely to happen. They use past data to model future outcomes. For example, predictive analytics can be used for better customer targeting. By knowing the preferences and lifestyle of consumers, a model can be built to allow companies to better predict what products to sell to certain customers. Another common application is the use of a credit score to predict the probability of a default.
Prescriptive analytics tells us what we should do about it. They predict multiple outcomes and provide recommendations on the next course of action. Prescriptive analytics are usually more complex to administer as they use a combination of techniques such as business rules, machine learning, and modelling. Examples include suggestions on the optimal route to travel to your destination, or A/B testing to identify the better performing of two versions of a web page.
Conclusion
This is a high level summary of data science and data analytics. There are certainly more advanced concepts such as machine learning, modelling and artificial intelligence to be covered.
Creating a data-driven organisation is not easy. However, with a proper understanding of the process and concepts, we are one step closer to the holy grail of leveraging on data and analytics to become smarter and more efficient.
